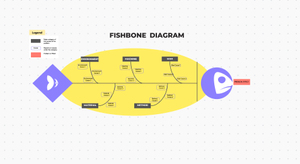
A fishbone diagram also know as Ishikawa diagram is an example of a cause analysis tool that provides the user a visual on the root causes of an identified problem. It is usually categorized into Man, Machine, Method and Material but other main categories can be indicated depending on the need of the analysis.

Fishbone Diagram
Add template to your ClickUp accountTemplate Includes
- Whiteboard
- Start Here


